You are currently viewing documentation for CompuTec ProcessForce 3.0, which is a plugin installed and managed through CompuTec AppEngine 3.0, built on .NET 8. If you are working with older environments, you may need the documentation for CompuTec ProcessForce 2.0: https://learn.computec.one/docs/processforce/2.0/.
Please note that CompuTec ProcessForce 2.0 will be supported only until December 31, 2026. After this date, the product will no longer receive regular support or maintenance updates. Read more
CompuTec AppEngine 3.0 introduces a new architecture, and all CompuTec components, including the CompuTec ProcessForce 3.0 plugin, must be updated together to ensure full compatibility.
Before starting your installation or upgrade process, we strongly recommend reviewing the CompuTec AppEngine 3.0 and CompuTec ProcessForce 3.0 documentation.
Reports
Plant Maintenance reports provide valuable insights into various aspects of meter readings and MI (Maintenance Item) structures. These reports help streamline maintenance operations by offering detailed historical data, document links, and hierarchical structures for efficient analysis. Below are the key reports available within the Plant Maintenance module:
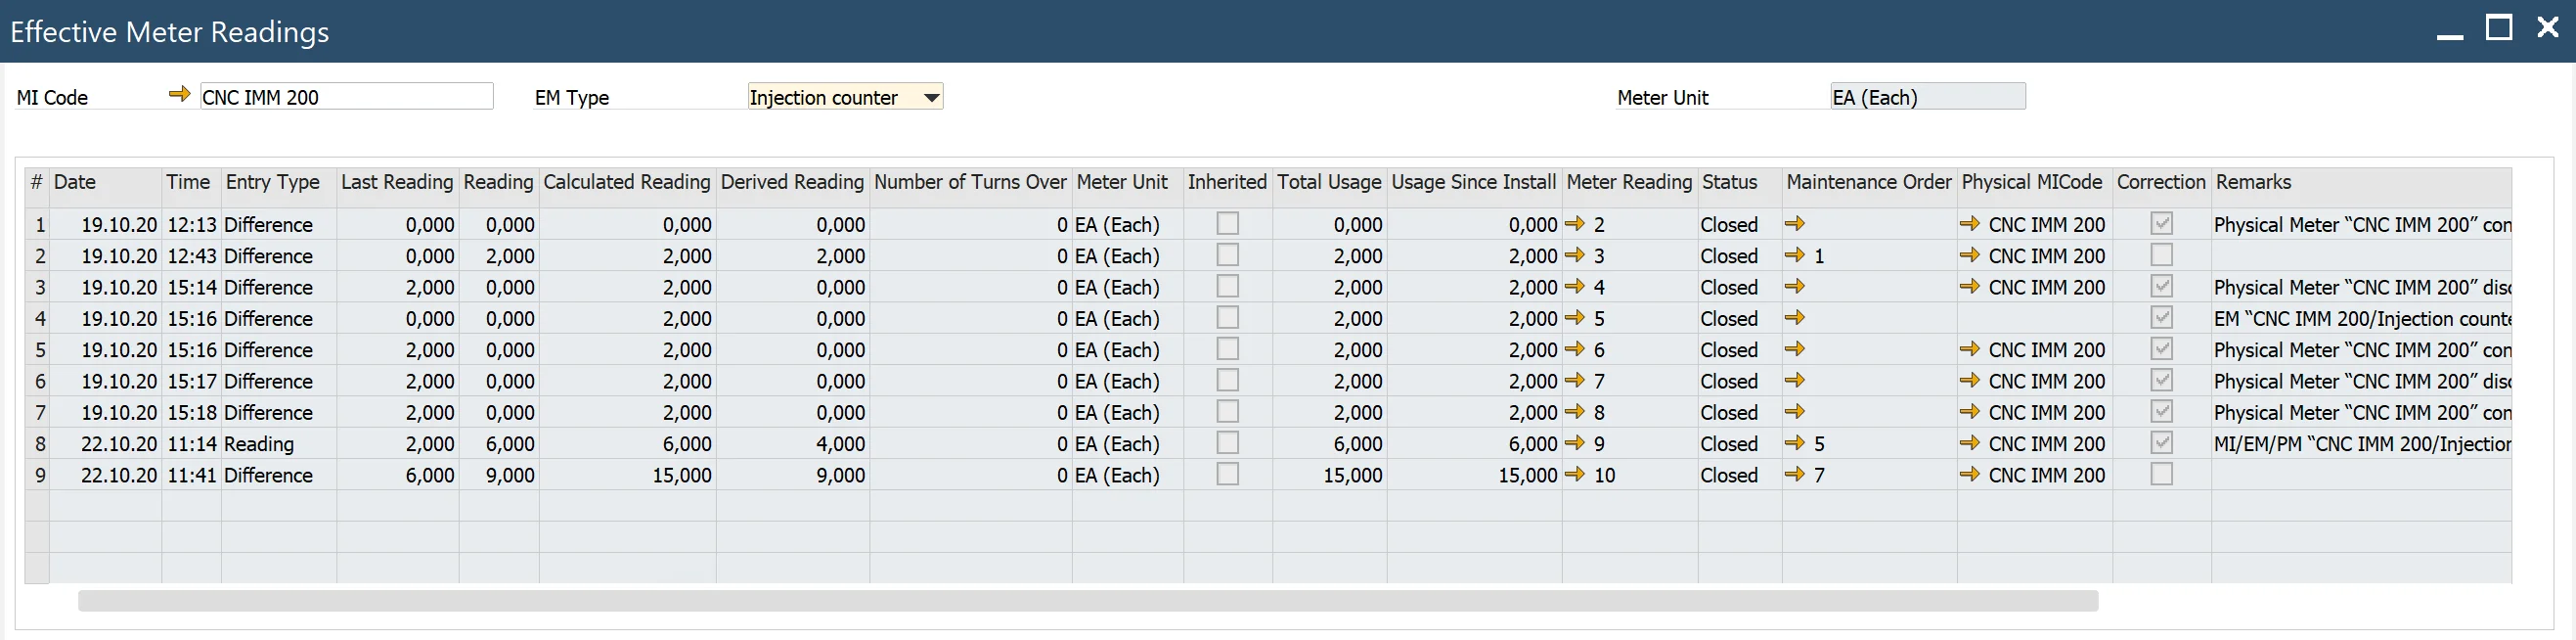
Effective Meter Reading History
Main Menu → Plant Maintenance → Reports → Effective Meter Reading History
This report enables users to view historical effective meter readings. By selecting values in the header, such as MI Code or EM Type, users can access a grid displaying the corresponding readings. Each reading includes a link to its source Meter Reading document, offering quick access to detailed information.
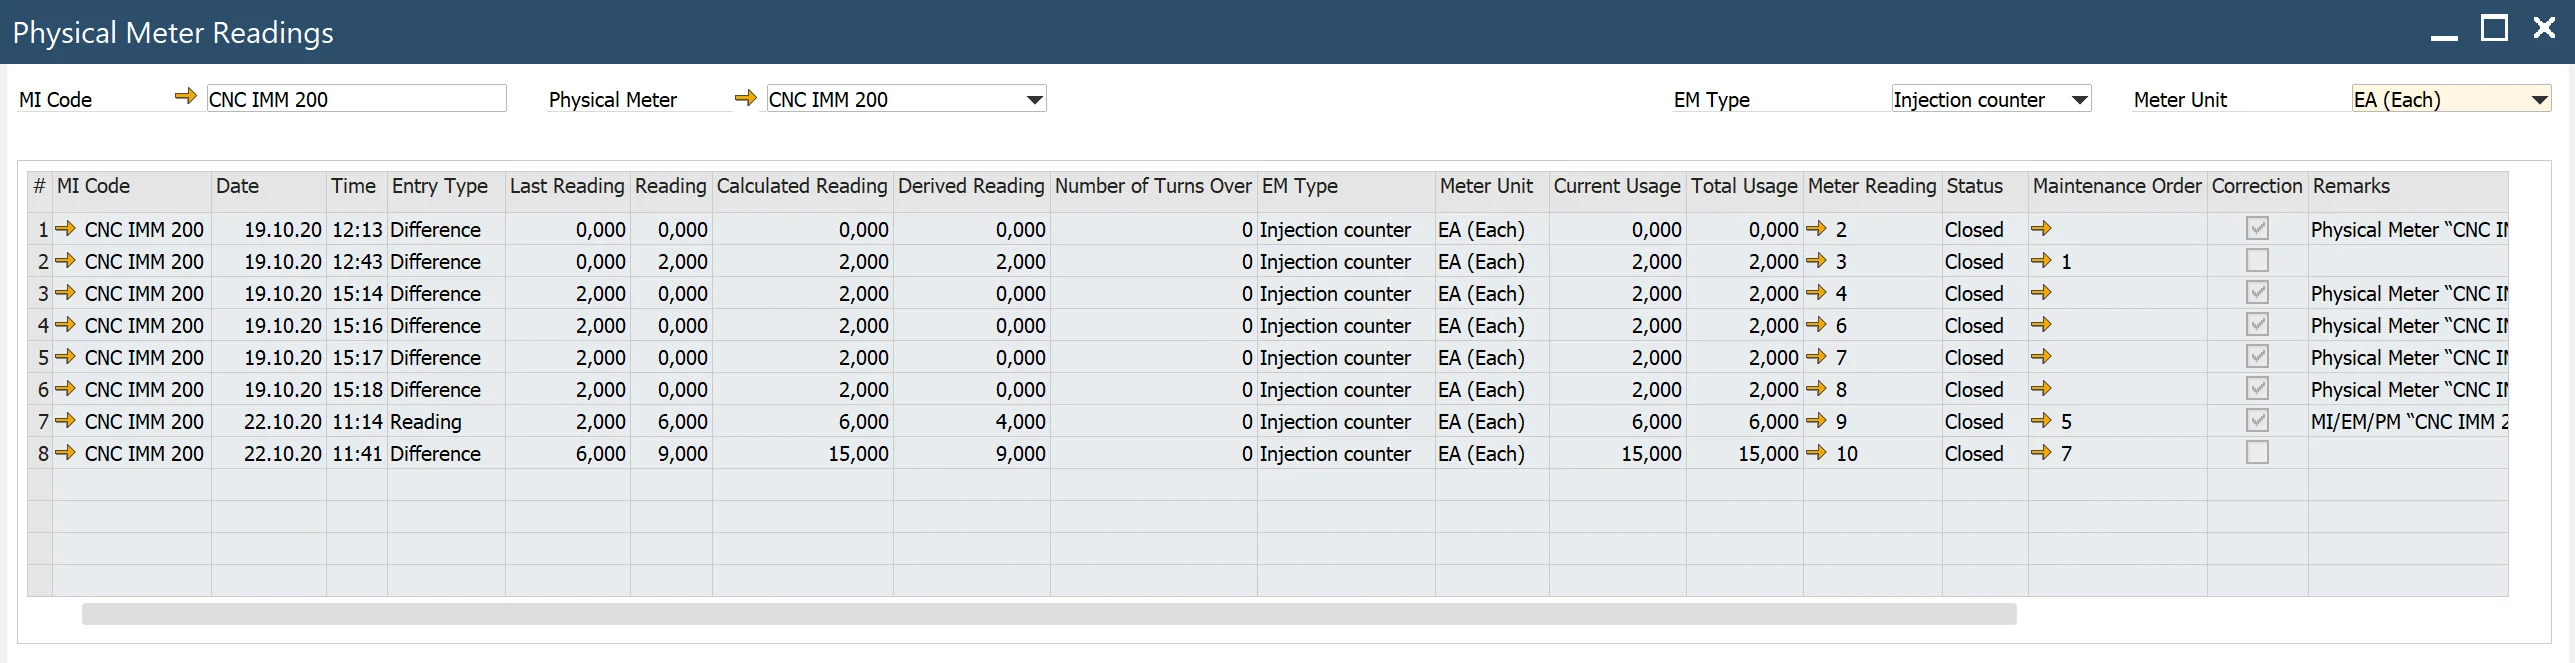
Physical Meter Readings History
Main Menu → Plant Maintenance → Reports → Physical Meter Reading History
The Physical Meter Readings History report allows users to review past physical meter readings. Users can filter the data by selecting MI Code or Physical Meter in the header. The grid displays readings along with links to the respective source Meter Reading documents for deeper insights.
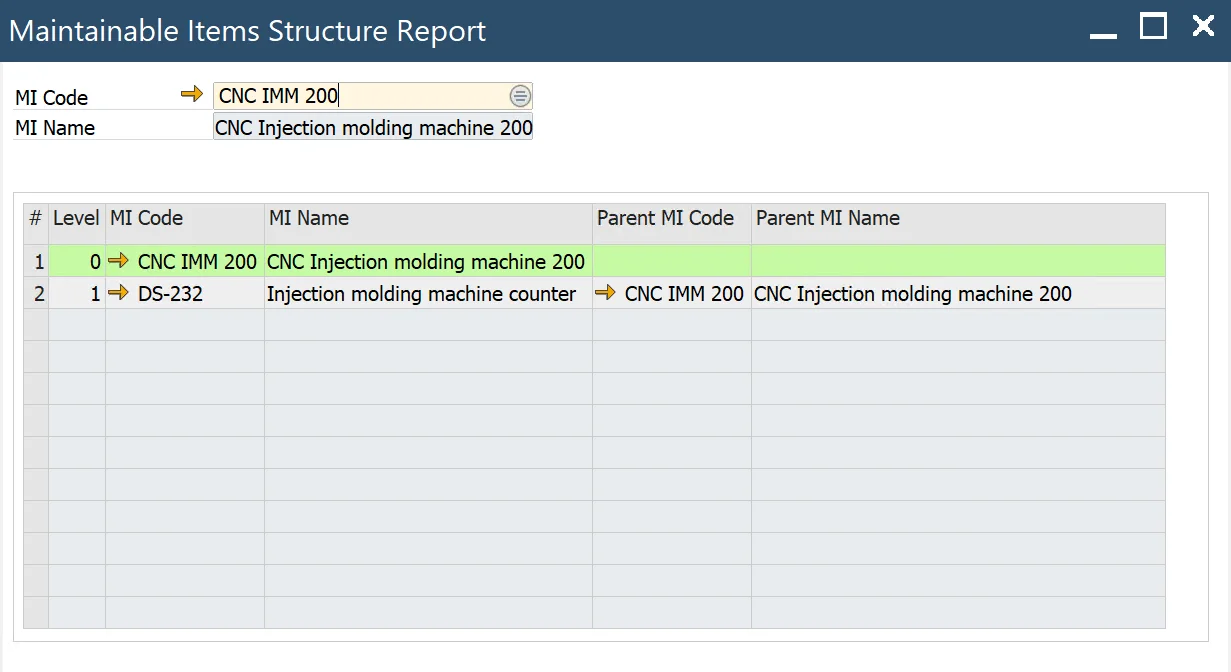
MIs Structure Report
Main Menu → Plant Maintenance → Reports → MIs Structure Report
This report provides a hierarchical view of Maintenance Items (MIs). Users can select an MI Code in the header to display a grid with all related MIs from the hierarchy. The selected MI is highlighted, making it easier to analyze its relationship within the structure.